Contents
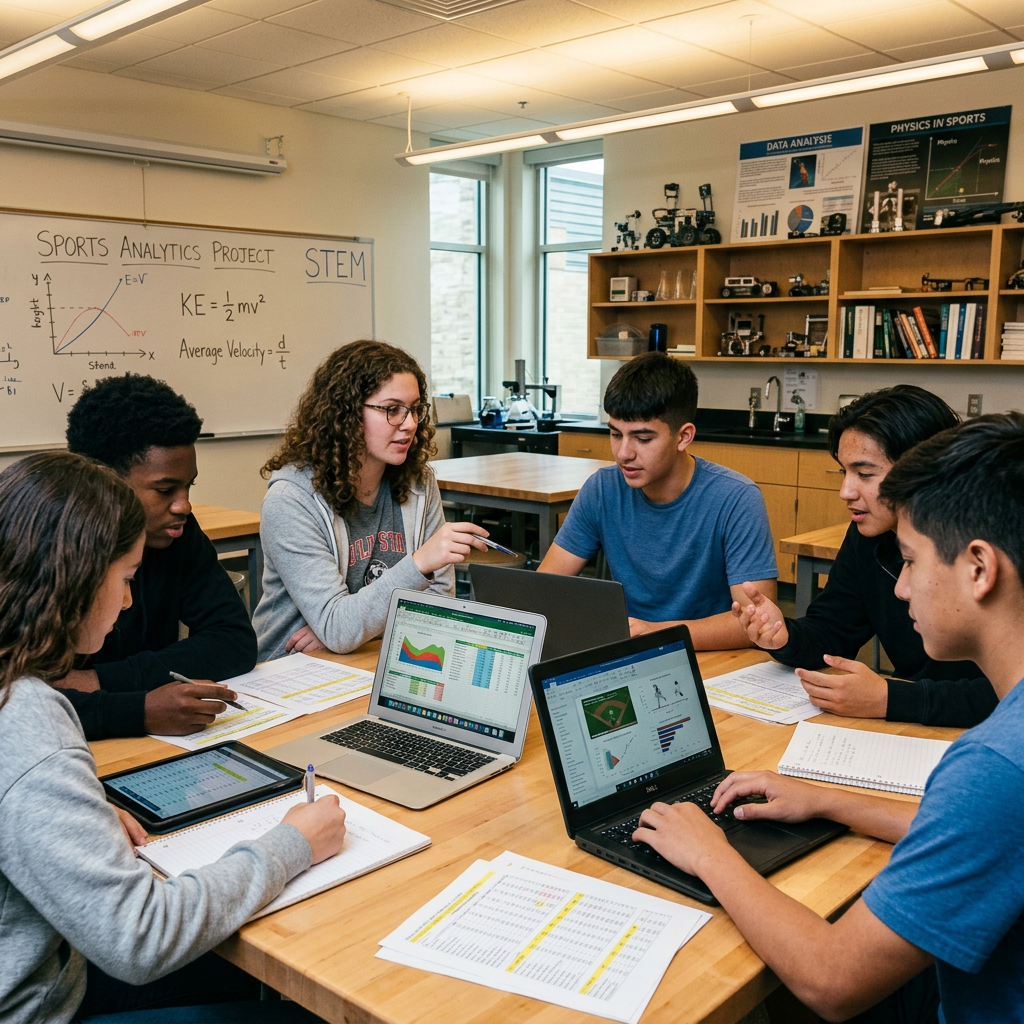
I’m standing inside a high‑school STEM lab where students analyze athlete performance curves instead of fantasy stats. The sixth seal is educational: performance‑anchored investing becomes a gateway to math, data science, physiology, and analytics — not gambling behavior. This is the shift from chance‑based risk to effort‑based value, and it’s transforming how we think about STEM education through sports analytics.
The Shift from Fantasy to Reality
Picture a classroom where students huddle around a dashboard displaying a basketball player’s sprint speed, heart rate, and shooting accuracy over a season. They’re not guessing outcomes for a fantasy league; they’re analyzing real performance data to understand what drives athletic success. This is the new frontier of STEM education through sports analytics — a powerful alternative to the gambling‑tinged fantasy sports that have crept into schools.
For years, educators have worried about students engaging in sports betting or fantasy leagues that mimic gambling behavior. But instead of simply banning these activities, forward‑thinking schools are replacing them with a richer, more educational experience. By using actual athlete data, students learn to ask questions, test hypotheses, and draw evidence‑based conclusions — all while staying engaged with the sports they love.
This approach turns a potential problem into a powerful teaching tool. Gambling prevention education becomes less about saying “no” and more about saying “yes” to a data‑driven mindset. A performance analytics curriculum doesn’t just occupy students’ time; it builds skills that last a lifetime.
Why Sports Analytics Builds Data Literacy
At its core, sports analytics is about making sense of numbers. When students calculate a player’s average points per game, they’re practicing arithmetic. When they graph a sprinter’s split times, they’re learning to visualize data. When they use regression to predict a team’s win probability, they’re diving into statistics. All of these activities build data literacy in schools — a skill that’s increasingly essential in every career.
But the benefits go beyond math. Analyzing performance data requires critical thinking: Is this metric meaningful? What factors might be confounding the results? How can we improve the data collection? These questions mirror the scientific method and prepare students for rigorous inquiry in any STEM field.
Student engagement through sports is naturally high, which makes analytics a perfect hook. A student who might tune out during a traditional statistics lesson will eagerly calculate a quarterback’s passer rating. The context of sports makes abstract concepts tangible and fun.
Moreover, data literacy isn’t just about consuming data; it’s about producing it. Students learn to design their own metrics, collect data from game footage or wearable sensors, and present their findings. This hands‑on approach cements learning and sparks curiosity.
Designing a Performance Analytics Curriculum
Integrating a performance analytics curriculum doesn’t require a complete overhaul of existing subjects. Instead, educators can weave analytics into math, science, and even physical education classes. Here are practical steps to get started:
- Start with free data sets from sources like Kaggle (e.g., NBA shot logs, MLB pitch data) or public APIs from sports leagues.
- Use spreadsheet software (Google Sheets, Excel) for basic calculations and graphing, then introduce tools like Tableau or R for advanced analysis.
- Design lesson plans around real questions: “Does home‑court advantage really exist?” or “How does player fatigue affect performance?”
- Partner with local sports teams or university sports science departments to access real‑world data and mentorship.
- Incorporate wearable technology (heart rate monitors, GPS trackers) if budget allows, to collect live data during PE classes.
For example, a middle school math teacher might have students calculate mean, median, and mode of a player’s scoring over a month. A high school biology teacher could explore physiology by analyzing heart rate recovery data. A physics teacher might use projectile motion to model a basketball shot. The possibilities are endless.
Free Resource
The website SportsAnalytics.org offers free lesson plans and data sets for K‑12 educators. Check their “Education” section for ready‑to‑use activities.
Schools that have adopted this approach report higher engagement and deeper understanding of STEM concepts. Students who previously saw math as abstract suddenly see its real‑world application. And for those interested in sports science STEM careers, this curriculum provides a direct pathway.
From Classroom to Career: Real Pathways
A performance analytics curriculum doesn’t just teach skills; it opens doors. Students who excel in these programs often pursue degrees in data science, sports medicine, exercise physiology, or analytics. According to the Bureau of Labor Statistics, jobs in data science are projected to grow 35% by 2031, and sports‑related STEM roles are expanding rapidly.
Take Maria, a high school student from Boston who participated in a pilot program using basketball analytics. She learned to code in Python to analyze player tracking data and presented her findings at a local science fair. Today, she’s studying bioinformatics at a top university and credits the program with sparking her passion. “I never thought I’d like math until I saw it could help me understand how athletes perform,” she says.
Schools can further support these pathways by inviting guest speakers from sports analytics firms, organizing field trips to sports science labs, and offering internships with local teams. Such experiences make data literacy in schools tangible and career‑oriented.
Moreover, this approach naturally includes gambling prevention education by shifting focus from betting on outcomes to analyzing performance. Students learn that value comes from effort and data, not chance. This mindset is a powerful antidote to the lure of gambling.
Overcoming Challenges and Scaling Up
Implementing a performance analytics curriculum isn’t without hurdles. Common challenges include lack of teacher training, limited funding for technology, and resistance from stakeholders who view sports as non‑academic. However, these obstacles can be overcome with strategic planning.
- Teacher training: Offer professional development workshops focused on basic data analysis and sports contexts. Many online courses (e.g., Coursera, edX) are free or low‑cost.
- Funding: Apply for STEM grants from organizations like the National Science Foundation or local education foundations. Partner with businesses that value data literacy.
- Resistance: Show evidence of improved student engagement and test scores. Pilot the program with a small group and share success stories.
Scaling up requires a community effort. Schools can collaborate with each other to share resources and best practices. Parents and local sports enthusiasts can volunteer as mentors. The goal is to create a culture where student engagement through sports is seen as a legitimate educational strategy.
The Big Question
What if every school replaced fantasy sports with performance analytics? Could we turn a generation of gamblers into a generation of data scientists? The seal of educational uplift is within reach.
The shift from fantasy to reality is already underway. Schools that embrace this transformation are not only teaching STEM but also instilling values of effort, analysis, and evidence‑based thinking. It’s time to make performance analytics the new normal in education.
Leave a Reply